Mapping Open Contracting and IATI Data with TradeMapper
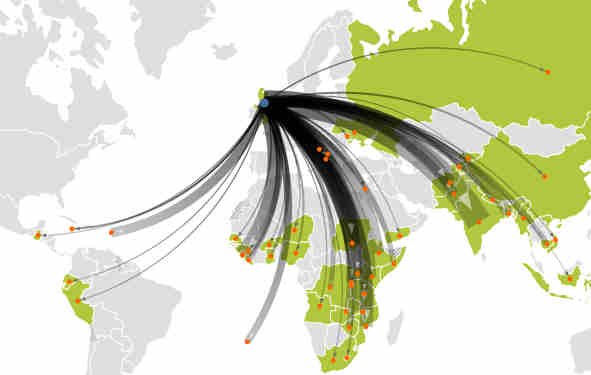
You can use TradeMapper, the open source, browser based mapping tool, to visualise any kind of international flow data, not just wildlife trade. Here is a demonstration using Open Contracting data.
Last week Tim Davies was in our Cambridge
office working with us on the data
standard for Open
Contracting. I showed him
TradeMapper and suggested
visualising international procurement patterns using the Open Contracting
data.
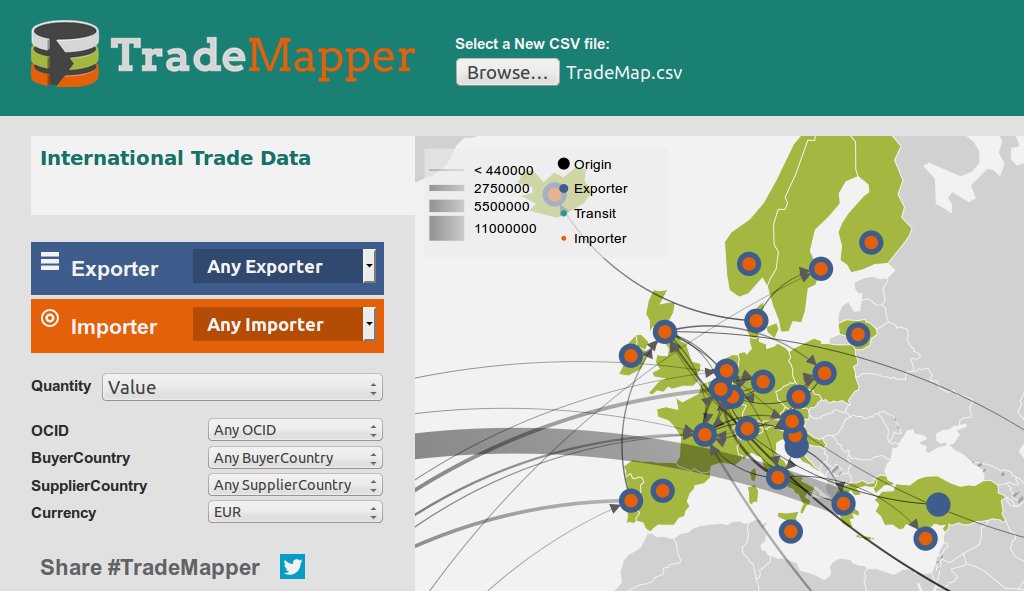
Not all open contract data has well encoded location data, but Tim took some time-out on a delayed train to create a CSV file from some European Union data that Development Gateway have converted to the draft Open Contracting standard. He used Open Refine to link to country names to ISO country codes that TradeMapper uses. Here's a gist of the steps he used.
I made a column mapping, so TradeMapper can open the resulting file and we had our proof-of-concept visualisation. Try filtering by Buyer or Supplier country.
We used a small, arbitrarily chosen file for this test, so it's hard to ascribe any meaning to the resulting image; but it demonstrates both the versatility of TradeMapper, and the potential for visualising international Open Contracting data, so we're hoping to do more work with it in the near future.
Come help us hack TradeMapper better at the upcoming hack day on 8 November.
Addendum: mapping DFID IATI data
It turns out IATI data includes recipient country codes. Knowing this I: downloaded all the DFID IATI files as CSV, opened them all in Open Refine, removed any rows without recipient country codes (some of the files are "regional" and don't have them), added a 'from' column, with value 'GB' (DFID being in Great Britain), removed all the columns we weren't going to be able to meaningfully filter by, to keep the file size down, pulled out the year from the Activity Start Data to give us a year to filter by, * hacked up a column mapping for TradeMapper.
The results are on-line here I've a lot of different types of data mixed up in here (6k lines) so it still isn't telling a clear story. But it's another demonstration of the potentialk power of TradeMapper to bring data-flow visualisation to the desktop.